
Election 2021: A Horizon Scan of English County Council Elections, Scottish Assembly Elections, and Welsh Parliamentary Elections since 1997

Thursday
the 6th May 2021 will be the Christmas Day equivalent in the
calendar of British psephologists, pollsters and electoral analysts. No, it is
not a day where research funding is handed out by a jolly man with a beard, nor
where other gifts of tenure or professorship are freely distributed. This being
said, there will be games and a feast – games of the political kind and a feast
of elections to ponder. Indeed, May 6th is the first Thursday of May
and that means election day. Unlike other years, 2021 is a year in the
electoral cycle where the metaphorical stars align, so to speak. Across the United
Kingdom (UK) 21 county councils, 124 borough and unitary councils, 13 Mayoral
offices, a parliamentary by-election for Hartlepool, 39 Police and Crime
Commissioners, the London Assembly, and all the respective 60 and 129 seats of
the devolved Welsh and Scottish assemblies, will undergo their first election
since 2019, 2018, 2017 or even 2016 – a passage of time that, given the
COVID-19 pandemic and ‘Brexit’, perhaps make these previous elections feel as
if a lifetime ago, both socially and politically. Take the Welsh and Scottish devolved
parliamentary elections as an illustration, taking place before even the
‘Brexit’ referendum and closer to the October 2014 Scottish Independence
referendum than the present. How different the political landscape appears
today, and how much the volatility of voter attitudes have saliently adapted
since then.[1]
May
the 6th, subsequently, will be the electoral feast of the UK’s
political system for 2021. Due to the sheer number of potentially significant
political changes that might arise from this banquet of elections, it is only
fitting that the recent statistical history of these elections be assessed
before the ballots are counted, so that an understanding of these elections may
be obtained and perhaps even predictions made. Such an endeavour will be the
task of this investigation. Naturally, as there are so many elections to take
place on the 6th of May, and in order to avoid an information
overload whilst providing a historical summary of electoral statistics, only a
handful of these elections will be selected to undergo analysis. Of course,
such a choice greatly limits the scope of this horizon scan, but it has been
done so to save the reader (and the author) the task of analysing even the most
granular level of attitudes and electoral preferences that may be only of
interest to certain data scientists and the residents of such localities.
With
the above in mind, this piece shall seek to understand, explain and assess the
statistical history of three sets of elections that will be held on the 6th
of May. These three will be the elections for: (1) English County Councils, (2)
The Scottish Parliament, and (3) The Welsh Assembly. The choice to limit the
focus of this investigation to just these three ‘sets’ or ‘modes’ stems from a decision
to focus the reader’s attention on, arguably, the three most significant
elections to be held in the UK in 2021. The Scottish and Welsh parliamentary
elections will decide the future of the policy the devolved powers implement.
In the case of Scotland, this could be the difference between illustrating a
still popular bid for independence, with the re-election of the Scottish
National Party (SNP) as the largest – if indeed majority – party in Holyrood,
or a greater will not only to remain in the union, but to accentuate a
preference for the Westminster government, with a potential increase in votes for
the Conservative Party. In Wales, the question remains as to whether or not the
longstanding control of the devolved assembly by the Labour Party will continue
or be whittled down, alongside that of the status of the United Kingdom
Independence Party (UKIP), for whom electoral popularity has decreased across
Great Britain broadly since the assembly’s most recent election in 2016. As for
English County Councils, a great deal of local politics takes place in the 24
county councils up for election, controlling the fate of the majority of
services their constituents experience. In most cases, the Conservative party
reap the benefit of county council elections, with the previous election in
2017 leaving the party controlling 24 of the then total 27. The question here
will be the extent to which four more years of Conservative government may have
strengthened or weakened the party’s hold over the bodies that administer
public services at the county level.
This
is not to suggest by any means that elections of Borough and Unitary councils
are less salient or interesting, nor that of Mayoral offices or Police and
Crime Commissioners. Nonetheless, at the levels that this investigation will
seek to understand and analyse, the events of the past four or five years – be
it Brexit, COVID-19, or any of the other spectacles that appear to have steered
our political course – can be assessed as to whether or not the actions by
specific parties have led to their electoral benefit. As for Borough and
Unitary councils, in many ways the issues that will decide their outcomes may
be increasingly granular, relating to locality-specific issues and
personalities. In order to assess these factors with any form of rigour would
require a far greater study than the one I propose to engage here, or that I am
willing to dedicate the reader’s time to. At these three sets of elections, the
larger, increasingly national, issues at play in our current political discourse
will be a key factor in deciding their outcomes, and as such, they are
elections that all may ponder or attempt understand without a prior knowledge of
local issues that for the smaller councils are essential to grasping why a
particular candidate or party has been elected.
Equally,
it must be said that these elections come at an interesting juncture. The UK
has formally left the European Union (EU) and the effects of this decision are
beginning to appear on the surface of enquiry, be they positive or negative.
Additionally, central and devolved governments’ decisions as far as their
COVID-19 response will be assessed – with the Conservative party having decided
for England, Labour holding the lion’s share of responsibility for the response
in Wales, and the SNP in Scotland. Indeed, these elections are not only interesting
on their own terms, for the control of counties and assemblies, but also as a
measure of public attitude towards the status-quo of the day, and the
respective governments and parties that administer such a status-quo.
As far as structure is
concerned, each set of elections will be explored, analysed and discussed
individually. The first of these will explore general British trends at the
local level before discussing past English county council elections, here utilising
data from 1997 onwards in order to descriptively and analytically engage with
the trends and patterns within the data. Following this, Scottish Assembly
elections will be placed under the statistical microscope, using data from the
first election to Holyrood in 1999 to the most recent election in 2016. Here,
after the Additional Member System (AMS) has been clearly unpacked, the data will
undergo an inspection and those trends that are of interest shall be
highlighted. Lastly, prior to a concluding section, Welsh Parliamentary
elections will come into the limelight.
I.
General
Trends and English County Councils
On May 6th 2021, 21 of
the 24 English county councils will come up for election. In 1997, the total
number of county councils sat at 34, before its decrease in 2009 to 27. Once
again there has been another decrease in the number of English county councils.
Since the last election in 2017, three more territories have been diffused into
multiple unitary authorities: Buckinghamshire, Northamptonshire and Dorset.
Equally, Cumbria, North Yorkshire and Somerset county councils have chosen to
hold their elections in 2022, following plans to become unitary authorities
also by next May, not wishing to confuse the electorate with multiple elections
in succession for differing structural authorities and bodies.[2] This brings the number of
county councils holding elections in 2021 to the number of the same year – 21 –
how fitting.
Throughout this section,
the electoral history of unitary authorities does not come into consideration.
To many this may be a puzzling choice as a great deal of the British population
live under the administration of unitary authorities and not county councils.
Similarly, unitary authorities tend to include highly populated and metropolitan
areas – favouring the Labour Party historically. As such the data which will be
presented on County Councils below leans heavily towards illuminating
Conservative party control of local government. The reason why excluding
unitary authorities has been a conscious decision is twofold. Firstly, the
number of authorities changes not only year by year, as illustrated with the
decrease to 21 county council authorities presently, but also, secondly, as
unitary authorities operate by different electoral procedures, with some electing
the entire council periodically, of which this period can differ, and some
electing a fraction of the seats with every passing year – in a similar manner
to that of the United States’ Congressional Senate. Subsequently, the variables
needed to be accounted for in order to present an investigation of such a
magnitude are beyond my own capabilities, and require the mind of an
experienced political scientist or psephologist to coordinate. With this therefore,
I have chosen to focus my attention on county councils and, specifically, the
statistical history of those holding elections in 2021.
Turnout[3]
Generally speaking, turnout has been recorded as decreasing across elections in the UK for some time now. As far as general elections are concerned, 2019 saw a turnout of 67.3%, and although this is far greater than the 2001 low of 59.4%, it was still not as high as the 71.4% of 1997 or even the 68.8% turnout of 2017. If we are to take a look at the turnout for English county council elections over the course of the past 24 years, the trend is clearer and bleaker.

Figure 1a. above details turnout at English County Council local elections between 1997 and 2017. There are a number of significant factors that can be deduced from this graph, the obvious being the noticeable decrease throughout the course of the 21st century so far. 1997 saw a 73.2% turnout, with a low in 2013 of 30.6% (less than 1 in 3) and 34.8% at the last election in 2017. Indeed, if the linear regression (the trendline) is continued to 2021, we should estimate a turnout of around 15-25%. Fig. 1a. reveals an average turnout in the period of 50.67%, and although the trendline, if followed, predicts a turnout almost two standard deviations below the mean [μ-2σ], the probability that turnout will fall below the level of 2017 is only 16.62% [where p = 0.1662], and that it will rise beyond that of 1997 is, sadly, almost half this, at 8.44% [where p = 0.0844].[4] Therefore it should come as no surprise to the reader if turnout is to fall; the question is to what degree, and whether or not this would defy the 83.38% probability of increase from that of 2017 – but this is a probability that takes into account the dataset as a whole, irrespective of trend.
General Trends[5]
Before English county
councils up for election in 2021 can be investigated, some general trends of local
elections should be detailed and unpacked first, so a general understanding of
the lay of land can be grasped before an increasingly focussed analysis is undertaken.
Therefore, the question must be asked - how have the major parties faired at
local elections broadly over the course of the past two decades in Great
Britain?


Figure
1.b. above describes the annual estimated national vote share (%) of the major
parties at local elections in Great Britain between 1997 and 2019. There are a
few significant trends that require explication. The most salient trend
concerns the Labour and Conservative parties, who despite minor parallel trends
of decrease across the time period remain somewhat stable between 22-43%. As
far as vote share is concerned, the Conservatives have remained roughly
consistent with a mean of 35%, a low of 26% in 2013 – the mid-point of the
coalition government with the Liberal Democrats – and a high of 43% in 2008;
yielding a statistically insignificant decreasing linear regression between
time and vote share [where ŷ = -0.109x+254.449 and p =
0.447]. Labour’s historical vote share has been slightly more varied but, on
the whole, displaying a similar trend of decrease across the period, if but a
fraction more stable [ŷ = -0.057x + 145.99], with a mean of 31%,
a high of 42% in 2001 and a low of 22% in 2009; all in all, equally yielding a
statistically insignificant relation between time and vote share [where p =
0.766].
This
being said, the probability that the Conservatives will increase on their 2019
performance nationally (of 31% [μ-1σ]) is high, at around 84 in every 100
[where p = 0.8413 under a normal distribution curve]. The probability
that Labour will increase its vote share as of 2019 is, rather interestingly
exactly 50:50, but with only a 4% probability that national vote share will
fall outside of its 2009 low (22%) and 2001 high (42%). Therefore, from Labour one
would not expect any significant shifts too far from the 2019 vote share.
However, probabilities are there to be proved incorrect and the political
landscape for Labour has indeed changed since 2019. What is significant,
however, are the changes in vote share within this period for the Liberal
Democrats, UKIP and all those ‘other’ political parties.
Let’s
take a look at the Liberal Democrats (LD). With a mean of 19.9%, the LD share
of the vote at local elections regresses across the period significantly [with
a linear regression coefficient of ŷ = -0.717x +1460.171 and
where p = 0.000064]; reaching their height in 2003 and 2004 with 27% of
the vote share, and a low in 2015, at what would be the end of their coalition
government in Westminster, of just 8%. Undeniably, although increasing their
share of the popular vote from 2017 to 2019, the jury is still out as to
whether or not the regression will continue or whether the LD are in fact on an
upward trajectory following their 2015 low. Either way, this election will
reveal which is the case. Nonetheless, in the period between 2013 and 2019, ‘Other’
parties gained a higher share of the popular vote than the LD, the supposed
third largest national party.
At
local elections in this period, the Conservative and Labour parties hold a
majority of the vote share, with a mean combined vote share of 66%.
Nonetheless, in the past decade the dominance of the major parties has not gone
unchallenged. In figure 1b., the estimated national vote share of ‘Other’
parties and UKIP are registered. Importantly, it must be noted that UKIP’s vote
share appears twice since 2013, being part of the ‘Other’ data series and
holding its own sequence alongside this since 2013, so that a greater look can
be taken at the party’s decline since then. In 2013, the ‘Other’ category, of
parties outside of the usual ‘big 3’, won the greatest share of votes – with
UKIP alone gaining 22% of the popular vote, just some 4% below the Conservative
party. Although tracing the rise and decline of UKIP, the role that smaller
parties have begun to play in local elections is undeniable, holding a greater
share of the popular vote than even the LD in 2019, and perhaps even explaining
the 11% combined decline in vote share for the Labour and Conservative parties
between 2018 and 2019, where ‘other’ parties gained 8% in the same
period. This illustrates a sense of the volatility that the inclusion of ‘other’
parties brings to contemporary UK elections.[6] How has vote share
translated into the number of councillors elected for specific parties in the
same period however?
Figure
1c. presents the party affiliation of councillors in Great Britain between 1999
and 2019. The first important clarificatory point to be made is that this
includes all modes and forms of councils, be they borough, county, unitary and
so on. As such it gives us a snap shot of party control of local government as
a whole in the time period. The first observation that is immediately
noticeable is the lack of proportionality between the percentage of votes any
given party receives and the number of council seats won.
There
are a handful of reasons for this. The first concerns how the electoral system
utilised differs from nation to nation, where local government councils in
England and Wales use the traditional First Past the Post system (FPTP) in
which each voter receives one vote and a simple plurality of votes wins the
seat. In Scotland however, the Single Transferable Vote (STV) is employed to
give a more proportional translation of votes to seats. Thus, as the number of
English and Welsh councillors outweigh those of Scottish councils, the results
will appear less proportional. Secondly, not all councillors and councils, as
discussed above, are voted for annually, and as such party affiliation of
councillors may not swing and change as much as the estimated national vote
share at annual local elections. For example, unitary and metropolitan
authorities tend to vote for Labour candidates in higher numbers, and as such
the years where there are fewer elections for these authorities will perhaps
see a reduction in the vote share for Labour but not necessarily a reduction in
the total number of Labour affiliated councillors. These two factors in tandem
explain why the immediate appearance of Figures 1b. and 1c. differ. What does
Fig. 1c. show nonetheless?
The
first observation one can make of interest is the initial crossover of
popularity between the Labour and Conservative parties between 2002 and 2003.
Following the 1997 Labour landslide general election, it appears that Labour
won the largest number of councillors annually well into New Labour’s first
term in power. Even so, throughout the period the Conservative party indeed
overtook Labour, leading to an overall high degree of correlation with the
passage of time and the total number of councillors [ŷ = 95.406x
- 183277.88, r = 0.5808, p = 0.005766]. If this trend were to
continue, we should expect the number of conservative councillors to rise
dramatically from its 2019 level, which may be the beginning of a new trend, or
an anomaly connected to turnout, voter fatigue or other factors. Indeed, the
probability under a normal distribution curve that this will be the case is
roughly 81 times in 100 [where p = 0.8137].
For
Labour and LD, the trend is undeniably a negative one. This being said, since
2009 Labour have begun to regain a number of the councillors that were lost in
the decade prior, repossessing some 1,896 council seats by 2019. Nonetheless,
the number of councillors affiliated with the Labour party appears to have been
stabilising, all be it with a small negative regression, since 2014. To expect
the number of Labour affiliated councillors to overtake the Conservatives is folly,
exceptionally so. Alongside this, the sheer drop of Conservative affiliated
councillors in 2019 provides space for the Conservatives to regain seats from
LD and the other parties, implying the situation by which this blip would be
anomalous or thoroughly contextual.
As
far as the LD are concerned, between 2006 and 2018 their number of affiliated
councillors in Great Britain reduced by over half (a reduction of some 2,850
councillors) before sharply increasing in 2019 to 2,531. Perhaps this is the beginning
of a new era for the LD? Equally as interesting are the affiliated number of
‘other’ councillors, i.e., those councillors unaligned to one of the bigger
parties. Fascinatingly, since 2014 the ‘other’ category has collected a greater
number of councillors than the LD – indicating that on the local level the
party system is perhaps shifting somewhat away from the ‘two-and-a-half’ frame
we have come to know, any slid towards that of an increasingly multi-party
system.[7] In 2019 the reality of
this became clear when an increase in the number of councillors for the LD and
other parties amounted to an aggregate gain of 1,294 seats, almost collectively
mirroring the aggregate 1,595 loss for the Conservative party. This led to the
number of non-major party affiliated councillors totalling at 2,655 – its
highest in the two-decade long data series. Aside from this interesting upsurge,
which can be clearly observed in Fig. 1b. also, the number of non-major party
affiliated councillors remained relatively plateaued, sitting between a
previous high of 2,362 in 2014 and a low of 1,787 in 2012. If on May 6th
this increases, it may be one more indicator that the tectonics of the British
party system are morphing, at least on the local level.
Figures 1b. and 1c. lay
out the data for counties and local elections in Britain as a whole. What can
be observed by looking at just council control in England alone, before honing focus
onto the county councils that will be up for election on May 6th?
English Councils[8]
Now
that a general idea of the trends in British local elections have been broadly
discussed, it is time to adjust our microscope by a single level. The scope of
this investigation will begin to concentrate not on vote share of local
elections or affiliations of councillors broadly in Great Britain as a whole, but
on the number of English councils controlled by party and the share of English
council control by party since 2005. Once this has been achieved, the ocular of
our focus may be permitted contract even further, so that the county council
elections on May 6th may be discussed effectively.


The
first noticeable trend concerns the sheer number of councils that the
Conservative party dominate the control of. At their most dominant in this
period, the Conservative party held 213 of the total 386 councils, some 55.2%.
Even given the large decrease of controlled councils for the Tories
(Conservative Party) from 2018 to 2019, a decrease of some 55 councils with a
Conservative majority of councillors, there was still a 15.2% difference ahead
of Labour – a large buffer in all cases. As for Labour, although initially
declining in the number of majority-controlled councils, hitting their lowest number
of controlled English councils in 2009 with just 33, the Labour Party have
regained much of the loss their experienced in the final years of New Labour,
remaining stable and controlling some 25-30% of the councils on offer; despite
a small decline in 2019.
What is interesting about Figures 1d. and 1e. is that the major parties remain in their positions, with the Conservatives leading, followed by Labour, the Liberal Democrats, and then the Independents/‘Other’. Thus, despite the sharp decline in the number of controlled English councils by the Conservative Party in 2019, a departure from this order would be a seismic adaptation of contemporary English council electoral outcomes. This, therefore, should not be expected. What is possible, however, is that the number of councils without overall control by any particular party (NOC) rises sharply.
The
historical number of English councils without overall control makes for
interesting reflection. As the number of Labour and Conservative controlled
English councils increases, the number of councils without overall control
decreases, naturally. Perhaps there is another correlation that can explain
this?


Figures
1f. and 1g. respectively report the total number of English Councils and
Councillors in Great Britain as whole. There are two great similarities between
the two, recognizably. The first concerns the decrease in the total number of
English councils between 2008 and 2009 from 386 to 351 and the mirroring of this
decrease by a reduction of 1,402 councillors. The second occurs between 2018
and 2019, where a reduction of 10 English Councils is paralleled by a loss of
463 councillors on the whole. This correlation is a natural one – the fewer
number of councils equates to a fewer number of councillors. What is absolutely
fascinating, however, is the correlation between the number English councils
without overall party control and the total number of councillors.
Statistically, the number of English councils without overall party control and
the total number of councillors, when analysed, hold a correlation coefficient
of r = 0.8169 and as such from 2005-2019 reports a p-value where p
= 0.000201. Therefore, with statistical confidence, a ‘null’ correlation
between the two can be rejected and it can be deduced that as the number of
councillors in Britain reduces as a whole, the number of councils in England
without partisan control generally increases.
In this manner, as far
as the overall trends for English Councils are concerned over the course of the
past fifteen years: (a) the Conservative party holds the lion’s share of
councils and by all accounts will continue to do so, (b) The Labour Party
remain stable after regaining a number of the councils lost during the New
Labour years, (c) despite a small increase in 2019, the LD and
Independent/’Other’ controlled councils remain stable, with less than 10% of
control, and (d) that as the total number of councillors in great Britain
reduces, the number of councils without any overall single party majority
increases in a correlative fashion. Now, at long last, we can begin to take a
look at English county councils, quietly lurking among the data that has just
been presented.
English County Councils[9]
Now that the results of
local elections at both the state-wide and English levels have undergone a
brief analytical exposition, and some limited grasp of the electoral horizon
ascertained, our scope of focus may turn to English county councils.


Figure
1h. details English county council control by party after elections from 1997
to 2017, and Figure 1i. presents the same data as percentage of controlled
county councils by party. By observing the trends in Fig. 1h, what can be
determined initially, before looking at the number of county councils that
parties individually control, is the shift throughout the period in the number
of councils. As detailed above, as time has trundled forward an increasing
number of county councils restructure their mode of local government to become
Unitary Authorities, dividing their territories into smaller administrative
zones that are more accountable at the local level. For example, the 2021
election will see a reduction in the number of County Councils by 3 as
Buckinghamshire, Northamptonshire and Dorset have undergone such restructuring;
the latter, for instance, has been divided into two Unitary Authorities as of
2019: Bournemouth, Christchurch and Poole Council, and Dorset Council. Thus,
throughout the contemporary history of English County Councils, there has been
a decline in the total number from 34 to 27 in-between the 2005 and 2009
elections, and now from 27 to 24.
Aside
from this, Fig. 1h. specifies rather clearly the nature of Conservative
dominance over English county councils throughout the past two decades. In 1997
the Conservatives held only 8 of the 34 English county councils, and by 2009
held 26 of 27, and as it stands hold 24 of the 27. Immediately, what can be
assured is that the share of councils the Conservatives hold will change, even
if the same result is produced as in 2017. This is so as the 3 county councils
that have undergone restructuring to become unitary authorities were
Conservative controlled assemblies. Thus, even if the same result as 2017
occurs, the number of English county councils controlled by the Tories would
decrease from 24 to 21. Despite this, one cannot ignore the Conservative
dominance of English County Councils that is clear to sense in Fig. 1h, who
since 2001 have controlled at least half of county councils up for election. By
focussing attention on Fig. 1i, this dominance can be better grasped in
assessing English county council control share by party.
Although
the stark increase in Conservative control is as plain as the nose on one’s
face, the most statistically significant correlation is the decrease in
Labour’s share of county council control. Fig. 1i. details that labour began
the period in 1997 with 23.53% of county councils, neck and neck with the
Conservatives. By 2009, this was reduced to 0, and after a brief increase on
2009 by 7.41% in 2013, the last set of elections in 2017 left the party once
again wanting for control of even a single county council. This decline is
statistically noteworthy, with a linear regression of ŷ = -1.249x+2517.986,
seemingly insignificant, but with a coefficient of determination of r =
-0.894, and as such holds a p-value where p ≤ 0.05. As time goes
on, the Labour share of county councils decreases correlatively. If this trend
can be predictive, it reveals that we should not expect Labour to increase on
their 2017 performance, remaining without control of a single English county
council.
Fig.
1i also reveals the negative correlation between the passage of time and the
share of English county councils without overall control, or control by the
Liberal Democrats (LD). Let’s begin with the latter. The LD only gained control
of 2 councils in 1997 and 3 in 2005. This does not mean that the LD share of
county council control may not increase at this election, but just that the
statistical probability is against them. Indeed, much like Labour, their goal will
be to increase their share of county councillors, as opposed to county
councils; a more probable achievement. What is fascinating however is the
manner in which Conservative share of English County Councils and the share of
councils without an overall party control mirror one another. In 1997, 47.06%
of county councils were without an overall controlling party – almost half. By
2009, this had been reduced to just a single council, before increasing to
where it lies today – at 3. Nevertheless, what unites both the LD and NOC share
of English county councils is their variation, and hence a statistical
insignificance to reveal any kind of predictive capability. This being said,
perhaps Figure 1j. can disclose more.
Even
though broadly displaying the same trends as Fig. 1i, Fig. 1j. presents the
number of councillors in English County Councils by party after elections for
those 21 county councils that will undergo an election come May 6th
2021. Although Fig. 1j. clearly demonstrates a positive linear regression
concerning the passage of time and the number of Conservative county
councillors. In 1997, there were only 618 conservative county councillors in
those county assemblies that will still be operating in 2021. Now, after the
2017 elections, there are 949, a clear increase that even reached 1010 in 2009
– the greatest number of affiliated county councillors in this period. This is
a trend that should not go neglected. Conversely, this correlation returned a p-value
where p ≥ 0.1, and so is statistically insignificant for being able to
confirm a correlation between the two sets of data (time and the number of
elected Conservative county councillors). Subsequently, if the trend is
anything to go by, and with an average (μ) of 801.833 county councillors
across the period, there is roughly a 1 in 7 probability that the Conservative
party will increase on its 2017 total [where p = 0.1421 under a normal
distribution curve].
Labour,
however, have slowly been decreasing their number of county councillors since
1997, beginning the period with 491 and winning just 212 in 2017. This should
not come as a shock. Certainly, the overall trend mimics that of figure 1c.
above, plotting the total number of councillors by party affiliation in Great
Britain after elections annually. In this manner, the relatively negative trend
of a decreasing number of Labour county councillors in the period since 1997,
with a slight bump in 2013 and then a decrease yet again matches the overall
trend that would be expected of the Labour party at this level – given the intensity
of overall support for the Labour party at local elections nationally.
Despite
this notion that the negative linear regression is overt for the Labour party,
what is of greater statistical interest is the correlation between the Labour
and Conservative Party’s gains and losses. In calculating a correlation
coefficient between the two series of data, i.e. Labour’s number of county councillors
after elections since 1997 and the Conservative’s number of county councillors
after elections since 1997, one finds that such a calculation produces a
coefficient of r = -0.9586, and as such a p-value of 0.0025. What
does this mean? Essentially, this indicates that the Labour and Conservative
trends are almost perfect mirrors of one another; when one increases the other
decreases. The scenario in which both gain or lose a number of county
councillors is somewhat statistically improbable. Subsequently, if we are to
expect the number of Conservative county councillors to rise, given the current
popularity of the Conservative party at national opinion polls, then we should
expect the number of Labour county councillors to fall below the current 212 mark.[10]
Although
likely to be of no significance in this election. What must be addressed is the
position of UKIP throughout the time period displayed in Fig. 1j. UKIP rocked
the foundations of local elections when in 2013 won some 123 county council
seats of those up for election in 2021 – some 8.5% of the total. Nonetheless,
by 2017 this was reduced to a single councillor. The significance of including
UKIP in this data series is to show that, in the past two decades, the only
real disturbance to the Conservative party’s trend of constant increase came
with the rise of UKIP in 2013. There is not a significant trend of correlation
throughout the period between the number of Conservative and UKIP county
councillors, however, what the rise and decline of UKIP has shown is the manner
in which the gains of a small party may shift the ideological or policy
currents underlying that of a major party in order to regain its lost seats –
as seen with the relationship between UKIP and the Conservative party.[11] Thus perhaps now the
Conservative party has shifted a step or two to ‘the right’ in order to regain
the seats that were lost to UKIP in 2013. This being said, this a discussion
for another day.
The final inferences I
would like to discuss, as far Figure 1j. is concerned, are the rather positive
trends of the Green Party and the number of those ‘other’ party affiliated
county councillors since 1997. In the two decades that Fig. 1j. presents, the
Green party went from achieving only 2 county councillors, to the 14 they hold
today – a 7-fold increase. Yes, some may say that this is only a slight
increase in terms of outcome, i.e. in two decades the Green Party have only
gained 12 seats. Be not fooled however, this presents a positive regression of ŷ
= 0.85x-1695.45 with a correlation coefficient of r = 0.86, and a
such there is a significant correlation between the increasing number of Green
county councillors and the passage of time [where p = 0.0280]. This
alongside a similar trend for non-major party aligned county councillors,
doubling from 1997 and 2017, tells us that there is simply a greater share of
the electorate willing to vote for candidates outside of the ‘Big 3’, and
perhaps this is one more factor that has contributed to Conservative dominance
of English county councils.
To Summarize...
In
this manner, all things considered: (a) we should expect the number of Labour
county councillors to drop, (b) the number of Conservative county councillors
to increase, but (c) without necessarily hugely increasing their share of
overall county councils controlled, and (d) perhaps even an increase in the
number of Green and non-major party-affiliated county councillors, which,
ultimately, if comes to pass, will (e) increase the likelihood of a greater number
of councils with no overall party control (NOC). Alongside this, turnout for
English county council elections should be expected to fall with some large
degree of probability; a result I humbly hope will not come to fruition.
As far as English councils as a whole are concerned: (a) the Conservative party holds the greater share of councils, and by all accounts will continue to do so; (b) The Labour Party remain stable after slowly regaining a number of the councils lost during the New Labour years; (c) irrespective of their small increase in 2019, the Liberal Democrats and Independent/’Other’ controlled councils remain stable, each holding less than 10% of control; and (d) that, significantly, as the total number of councillors in Great Britain reduces, the number of councils without any overall single party majority increases correlatively.
II.
The
Scottish Parliament
The Scottish and Welsh Electoral
Systems Explained
With
the introduction of devolution into the British constitutional system in the
late 1990s, Scotland, Wales and Northern Ireland formed elected assemblies in order
to administer the devolved regions and new powers that Westminster had given
them. Part of this constitutional shift was the use of proportionally representational
electoral systems where votes are translated into seats in an increasingly
proportional manner. As discussed above, at English and Welsh local elections
FPTP is employed, whereby each voter may cast a single vote for the candidate
of their choice and the candidate with the highest simple plurality of votes
wins the seat. Although this is traditional and uncomplicated to adhere to, it
favours those parties that concentrate support territorially and are well
known, whilst likewise significantly disregarding the proportional aggregation
of votes received for smaller parties across multiple constituencies. For
example, utilising the illustration of a General Election, in 2015 UKIP
returned only 1 MP out of the total 650 in the House of Commons, however
received 12.6% of the vote share nationally.[12] This questionably
undermines accountability and legitimacy from within the UK’s political system.
In order to modernise the British electoral system at its numerous levels, the
Scottish and Welsh Parliaments chose to employ the ‘Additional Member System’
(AMS) as opposed to FPTP for assembly elections. The following is a short
explanation of the manner in which AMS operates:
“Voters are given two votes on
separate ballot papers. One vote is for a constituency member and one vote is
for a party list. In Scotland and Wales list members are elected by region. In
London there is a single London-wide list. Constituency votes are counted first
and the members for each constituency are elected using first-past-the-post
[FPTP]. Additional members are then elected by counting the party list votes in
each region. The number of members elected from the list is based on the
percentage of the votes cast but also takes into account the number of
constituency members already elected in the region [utilising the d’Hondt
method of proportionality calculation]. This is designed to make the result
more proportional to the number of votes cast.”[13]
This leads to a number
of differences in the method of calculation for results to the Welsh and
Scottish assemblies in relation to that of English councils. In the data that
follows, ‘averages’ are weighted by the magnitude of seats allotted to the two
kinds of representatives ((i) Constituency and (ii) Regional Additional
Member). In Scotland, of the total 129 seats at the Holyrood assembly, 73 are
Constituency seats and 56 are seats for Regional Additional Members – creating
a weight of roughly 56.5% and 43.5% respectively. All aggregated metrics are devised
by employing these weights. Let’s begin by focussing on the turnout of Scottish
Parliamentary elections, prior to a brief analysis of the results since 1999,
the first of the devolved assembly elections.
Turnout for Scottish
Parliamentary Elections[14]

Figure
2a. exhibitions turnout (%) for Scottish Parliamentary Elections from
1999-2016. 1999 saw the first election to the assembly and it has seen four
elections since. Turnout for these elections has never recovered from its
initial high of an aggregate 58.8% turnout, and saw its lowest point at the
following election in 2003, with a collective 49.4%. Since then, turnout has
remained within these boundaries. As far as turnout for each branch of the
electoral system is concerned ((i) constituency and (ii) regional additional
member) neither one of these receives a greater turnout than the other overall,
with the greatest discrepancy between them occurring in 2007, where the turnout
for the regional list received a 0.7% higher turnout at 52.4%. Although there
being a mild-to-insignificant negative linear regression here, there is no
significant relation in pattern or correlation between turnout and the passage
of time, and as such makes it somewhat difficult to predict.
Nonetheless, as far as probability is
concerned, the average turnout across the period has been 53.2% with a standard
deviation (σ) of 3.48. Therefore, the statistical probability that turnout will
increase beyond that of 2017’s 55.6% is 24.5 in every hundred, almost 1 in 4.
Similarly, the probability that turnout will fall outside of its highest
(59.7%) and lowest (49.4%) aggregated measures is 19.4%, almost 1 in 5.
Accordingly, we should expect turnout to decrease if we follow the mild trend,
but it would be an unexpected surprise if it were to fall below 49.4%.
Scottish
Parliamentary Elections (1999-2016)[15]


What
are the dominant trends that can be perceived from Figures 2b. and 2d. which
detail the number of seats won at each Scottish parliamentary election, and
that from Figures 2c. and 2e., displaying the vote share by party? Before we
can do this, however, the question must be asked, do any of the parties benefit
in terms of vote share or seats due to the differing parts of the AMS electoral
system? Let’s discuss this party by party.
The
first party to discuss in relation to Scottish Parliamentary politics is the
Scottish National Party (SNP). In the past, as far as votes and seats are both
concerned, Fig. 2d. and 2.e illuminate that between 1997 and 2007, the party
benefitted mostly from AMS and the seats won through the regional party list.
From 2007 to 2016, with their growing popularity nationally, their share of
Constituency seats grew from 21 to 59 as their share of the popular vote at the
constituency level increased equally from 32.9-46.5%. Therefore, as AMS is
engineered to award more seats in proportion to the overall vote share,
balancing out the overall number of seats to a more proportionate level, it is
no surprise that the number of additional member seats the SNP gained from the
regional list declined. This being said, even in 2011 and 2016, where the
dominance of the SNP at the constituency level was made manifest, their share
of the vote at the regional level was still higher than the other parties’, at
44% and 41.7% respectively. In this manner, we should expect to see them
benefit mostly at the constituency level if their popularity follows the
meta-trend since 1999.
Following
this, Labour in Scotland have been the biggest losers across the period, with
their combined vote share and number of seats decreasing throughout. Indeed,
there is evidence to believe that Labour are experiencing an almost perfect
inverse correlation with the SNP in terms of the number of seats between the
constituency and regional additional member pools. By this, I mean to suggest
that there is a statistically significant positive correlation between the
number of constituency seats won by the SNP and the number of additional member
seats won by Labour, a rather high correlation in fact [where r = 0.9917
and p = 0.008107]. Therefore, from this initial analysis, it would be
statistically fair to claim that if the number of SNP constituency seats rise
further than the previous 2016 level of 59, the number of Labour’s additional
member seats will increase correlatively. Aside from this, the data illuminates
that Labour receives its greater vote share at the constituency level, with vaster
popularity within specific localities as opposed to broader regions.
As far
as the Conservatives, the Green party and ‘Others’ are concerned, the regional
party list provides their most effective mechanism for ascertaining seats in
the assembly, with the majority of their seats being won at the regional, as
opposed to constituency, level. This being said, on average, the Conservatives receive
a slightly higher share of the vote on the constituency level, at roughly 16.9%,
whereas this sits at around 16% from the regional lists. Nonetheless, the only
differential to this was in 2016, when Ruth Davidson’s Scottish Conservatives received
a higher rate of popularity at the regional level than at the constituency, by
some 0.9%. This was deemed to be a positive sign for conservatism in Scotland.
The question is the extent to which this slight increase in popularity will
have changed by 2021.
The
last to discuss, as far as whether or not the parties benefit more from one half
of the electoral system or the other, are the Liberal Democrats (LD). Between
1999 and 2007, the LD took most of their seats from constituency races, before
this changed in 2011 and the back in 2016. If we look at the same period in
terms of popularity, the LD return their greatest share from constituency races
throughout. Hence, it would be an inaccuracy to claim that the LD benefit
overall from either one of the pathways to ascertain seats at the Scottish
assembly. So, now it can be asked: what can we learn in terms of trends from
the overall weighted averages of seats and vote share from the past two decades
of Scottish Assembly elections?
From figures
2b. and 2c., certain trends are observable at just a single glance. The first concerns
the SNP and their increasing number of seats. Although a somewhat mild trend,
as time passes the share of seats that the SNP win increases. This is not a
continuous correlation, as in 2016 the SNP lost 6 seats overall and with it
their majority in the assembly, bringing their total to 63. However, as the SNP’s
positive linear regression of seat numbers and the passage of time is insignificant
statistically, all be it a clear positive correlation [where r = 0.8562
but p = 0.064029], there is little this trend can predict. Nonetheless, in
calculating a probability that is blind to the mild correlation, under a normal
distribution curve, the probability that the number of seats claimed by the SNP
will be less than their 2017 haul of 63 is 82.4%, and in falling outside of
their highest number (69 in 2011) and their lowest (35 in 1999) is 29.8%. Thus,
although vote share and number of seats are both increasing with a mild degree
of correlation, nothing is set in stone for the SNP, even if they do hold a 17.5%
probability of increasing their share of the seats.
Throughout
the electoral life-time of the Scottish parliament, the most statistically
significant trends actually sit with the Labour party, and so it is to them our
attention will turn. In both total number of seats and weighted average of vote
share, the Labour party has seen a general decrease in popularity across the period.
The greatest negative linear regression for the Labour party concerns their
total number of seats, decreasing from winning the greatest share of the
Assembly in 1999, with 56 seats, to the third most popular in 2016, with 24,
decreasing with every election. This rather significant and exceptionally
strong negative regression [ŷ = -1.847x + 3750.471, r =
-0.983, p = 0.002654], if extended to 2021 would see the number of Labour’s
seats reduced to 17. Whatever the case, either the trend continues with Labour losing
more seats, or the trend bucks and for the first time in two decades Labour
begin to see an increase on a previous election outcome. Either way, we will
see the continuation of a two-decade long trend, or its end, and both of these
outcomes would be fascinating. As far as Labour’s vote share goes, the trend is
one and the same – i.e. as time increases, the popularity of the Labour party
decreases. This presents just another reason to assume that the number of
Labour seats and MSPs (Members of the Scottish Parliament) will fall at this
election in Scotland, irrespective of the trend detailed above that as the
number of SNP constituency seats increase, so too do the number of Labour’s regional
list seats. Thus, perhaps a good prediction will be an overall decrease in
seats, but a small increase in the number of regional Labour affiliated MSPs.
For Liberal
Democrat and Conservative trends, their share of votes and seats are far too slight
in correlation with time to reveal a statistically significant relation. For
the LD, they are the only major party in Scotland to have experienced a
reduction in all of the variables detailed above, in terms of vote share (%)
and number of seats both for constituency and regional components of the Scottish
electoral system. Thus, with such a reduction in popularity, it is difficult to
statistically predict a LD resurgence in Holyrood.
Nonetheless, the
question really is if the Conservatives can increase their share of seats and
continue upon the potential new trend set in 2016 when they doubled their total
number of seats – from 15 to 31. Indeed, if in 1999 I was to be told that in
twenty-two years the conservative party will be fighting to increase their share
of seats as the second largest of the devolved Scottish assembly, I would have
told you that you were mad. Today, this is absolutely a possibility, and if
this trend continues with the Conservatives gaining more seats, perhaps
from Labour or the LD, it will signal a tectonic generational shift in Scottish
voter behaviour.
To Summarize…
In
summary there are a number of key findings to remember when pondering what the
results of the 2021 Scottish election will bring. Firstly, it is important to
discuss why this particular election in Scotland is significant. The question
of independence is still a popular issue in Scotland, with a YouGov poll from
the 4th of May 2021 reporting a 47% preference for an independent
Scotland.[16]
An SNP majority in the Scottish Assembly would enable the re-engagement of the
independence question and perhaps even be the beginning of the journey to ‘IndyRef2’.
Thus, the stakes of this election for its constitutional implications are
rather high. If the SNP were to get a majority of seats, it would be the first
time since the 2016 election that they would have done so, which fell before
the Brexit referendum and has become a potential driving force behind SNP
popularity. Equally, the ex-leader of the SNP, Alex Salmond, has formed his own
nationalist party ‘Alba’. Although it is highly unlikely that the introduction
of his party will deal much damage to the SNP, being formed less than three
months ago, the question really is the extent of the nipping that will take
place at their ankles.
So, the constitutional
stakes are high – what can be taken from this horizon scan of Scottish
parliamentary elections? As far as these trends are concerned: (a) as the SNP gain constituency seats, despite its
widespread losses Labour gain regional additional members. (b) The SNP should
be expected to win the largest share of seats, but the extent of their ‘victory’
is not statistically predictable. Despite this, the trend is that the SNP will
increase its share of seats and the popular vote. (c) The most statistically significant
trend across the time period is the negative correlation between Labour’s number
of seats and the passage of time. As time increases, the number of seats Labour
hold correlatively decrease, and as such we should expect Labour to have their
share of the Scottish Assembly hacked away at even further under Arthur’s Seat,
even if they see an increase in regional members. (d) Lastly, the Conservative
share of votes and seats will reveal either that 2016 was a statistical anomaly,
or rather that generational voter behaviour has undergone a seismic shift in Scotland.
Whatever occurs, the outcome may indeed reveal the constitutional future of the
United Kingdom. In short – watch this space.
III.
The
Welsh Assembly[17]
I do
not want to keep the reader from their daily business much longer, and as such,
after discussing English County Councils and The Scottish Parliamentary
election, this investigation will finally discuss the Welsh Assembly elections to
be held on May 6th, before parting with some concluding remarks.


The
first thing that must be discussed concerning the Welsh Assembly (Senedd Cymru)
is its electoral system. Coming into being at the same time as the Scottish
devolved authority as part of New Labour’s constitutional reforms, the Welsh
Assembly elects 60 MSs (Member of the Senedd) using the increasingly proportional
AMS electoral system. The same method of weighting averages by the magnitude of
Constituency and Regional Additional Members will apply also to aggregate
totals.
Since
1999, Figure 3a. displays that turnout is relatively stable between its lowest
point (38.1%) in 2001 and its highest (46.3%) from the first election of the
assembly in 1999, something that it shares with the Scottish Parliament. In the
three elections since 2001, aggregate turnout has remained within this 6.2%
difference, persisting relatively stable throughout without any statistically significant
regression or correlation, be it positive or negative. As far as the probability
of a turnout increase or decrease can be predicted, there is an 82.5% probability
that turnout will sit between 38.1% and 46.3%, within the usual span. However,
there is an almost 1 in 5 probability [p = 0.1976] that turnout will increase
on the 45.4% level of 2016, and far less likely outcome that turnout will drop
below the 2001 level of 38.1% with a probability of just over 5% [p =
0.0513]. Therefore, I would expect that turnout will remain at its usual and
stable level, more than likely between 40-45%.
Figures
3b.-3e. detail that on the whole only Labour benefits from either one or the other
forms of electoral processes involved with AMS. Labour generally takes more
seats from constituency level races, and as such less from the regional races.
Aside from this, all the other parties benefit in near equal measure from both
at varying levels across the five elections.
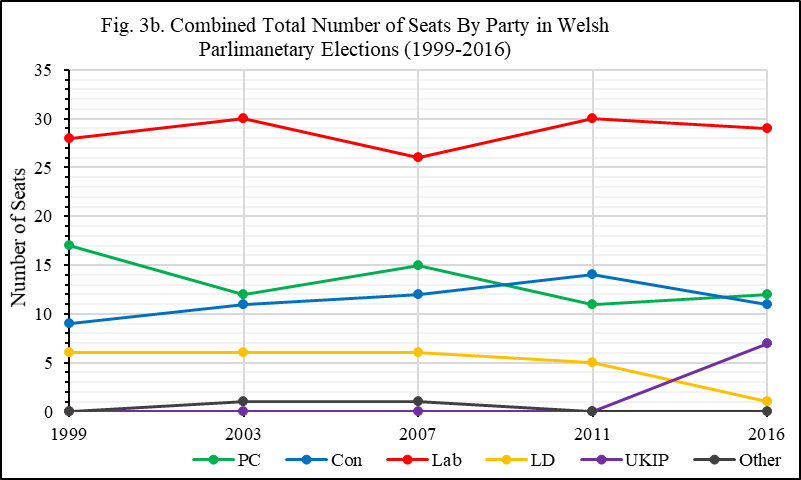
The
data illustrates that the Welsh Assembly elections remain so stable to the
point at which any correlations are statistically questionable as to their
predictive capability. Labour have always held the greater number of seats, but
the number has varied only minimally, with its lowest result in 2007 where Labour
claimed 26 seats, and its highest in 2001 and 2011 where it won 30. The other
results fall within this small buffer of just 4 seats, and emerging from the
2016 election with 29, almost half the total number of seats but with 33.6% of
the total vote. This raises a single concern, being whether or not AMS is
delivering enough proportionality in Wales. With this being its raison d’etre,
if the electoral system is not delivering proportionally, but returning a
Labour ‘bias’ somehow continually, perhaps a review of the electoral system
will become a priority for the majority of other parties in the Assembly if Labour
win yet another election in Wales.
Aside
from this, all the other parties are either in a stable deadlock over a handful
of seats, as we can see the Welsh nationalist Plaid Cymru (PC) and the Conservative
Party are, or are steadily declining in seats or vote share, as the LD are. The
other party that will be of interest to those following Welsh Assembly politics
is the status of UKIP. In 2016, UKIP returned some 7 seats with 13% of the
popular vote. Since then, there is but only 1 UKIP MSs remaining, with several UKIP
MSs joining tear away organisations or sitting as independents, such as Mark Reckless
who defected in 2014 from the Conservative party to UKIP when an MP for Rochester
and Strood, before losing re-election the following year. For a number of the
parties in the Senedd, this diffusion of UKIP presents the opportunity to
increase their share of the regional additional member seats, and subsequently
perhaps the decline in support for UKIP since 2016 will open the space for
greater competition and contestation for the seats within the Welsh Assembly.
In summary, from the May 6th elections for the Welsh Assembly, we should expect: (a) turnout to remain around 40-45%, (b) Labour to win a majority of the seats and votes, and (c) for the number of UKIP seats to dramatically drop, and with that perhaps even the independent MSs who defected from UKIP, but won regional party list races. As for PC, the Conservatives and LD, as there are no statistically significant trends, there is a very low predictive capability from this data as to what we should expect to happen. In this respect, the parties have everything to play for.
Conclusion
In
conclusion, this ‘Super Thursday’ election on May 6th 2021 will
reveal a lot about the current state of political behaviour in the UK. All eyes
will be sat on Hartlepool as the loss of another Labour seat in the once vast
red wall will make concrete the scenario that Labour are simply not connecting
with their ‘typical’ voter. If Hartlepool flips blue this will signify a new
are because this seat has never returned a Conservative candidate in the whole
period since its first contest in 1974, not even in 2019 when the red wall was
breached, where similar constituencies such as Workington flipped blue for the
first time. For Hartlepool to elect a Conservative something is indeed wrong with
the manner in which Labour is connecting with the electorate.
This
concern will not end at the boundaries of Hartlepool. Although the unitary
authorities that make up most of the red wall were not discussed in this
investigation, county councils such as Lancashire and Derbyshire that make up
parts of the old Labour heartland are. This election is Labour’s to lose, and
if it does so this election will forever appear as the second half of the 2019
general election, where the seismic shifts that categorised this election were
made concrete, where more nails were driven into the coffin of Labour hopes to
once again take government broadly at both the national and local levels.
This
will be a bizarre election for a number of reasons, not only because of the ‘Brexit’
effect on political narrative since the referendum in 2016, which we seem to
have absorbed into the nomenclature of discourse, but also because of the effect
of COVID-19. The counts will take longer due to social distancing measures but
this will only intensify the wait to find out whether or not Boris Johnson and
the Conservative government will have of achieved something rare – for a
governing party to pinch councils and seats from the opposition whilst in power,
and for so long at that.
Therefore,
I would like to leave the reader with a summary list of what perhaps to expect
from this election in 2021 as a whole. As far as councillors and county
councils across Britain are concerned, all things considered: (a) we should
expect the number of Labour county councillors to drop, (b) the number of
Conservative county councillors to increase, especially with the decline of
UKIP and the increase in individual voter volatility since 2015 with the
achievement of Brexit, but (c) without necessarily hugely increasing their
share of overall county councils controlled, and (d) perhaps even an increase
in the number of Green and non-major party-affiliated county councillors,
which, ultimately, if it comes to pass, will (e) increase the likelihood of a
greater number of councils with no overall party control (NOC). Alongside this,
turnout for English County Council elections should be expected to fall with
some large degree of probability.
As
far as English councils as a whole are concerned: (a) the Conservative party
holds the greater share of councils, and by all accounts will continue to do
so; (b) The Labour Party remain stable after slowly regaining a number of the
councils lost during the New Labour years, but the effect of their unpopularity
in their old heartland may indeed reverberate to council composition; (c)
irrespective of their small increase in 2019, the Liberal Democrats and
Independent/’Other’ controlled councils remain stable, each holding less than
10% of control; and (d) that as the total number of councillors in great
Britain reduces, the number of councils without any overall single party
majority increases correlatively.
In
our discussion of the Scottish Parliamentary elections, we found that we should
recall that: (a) as
the SNP gain constituency seats, despite its widespread losses Labour gain
regional additional members. (b) The SNP should be expected to win the largest
share of seats, but the extent of this win is not statistically predictable. Despite
this, the trend is that the SNP will increase both its share of seats and the popular
vote. (c) The most statistically significant trend across the time period was
the negative correlation between Labour’s number of seats and the passage of
time. As time increases, the number of seats Labour hold correlatively
decrease, and as such we should expect Labour to have their share of the
Scottish Assembly reduced, even if they see an increase in regional members.
(d) The Conservative share of votes and seats will reveal either that 2016 was
a statistical anomaly, or rather that generational voter behaviour has
undergone a seismic shift in Scotland. (e) This is a high stakes election, with
the SNP potentially opening the way to another independence referendum if they receive
a majority that they have not held since before the Brexit referendum.
Finally,
from the Welsh Assembly we should expect: (a) turnout to remain around 40-45%,
(b) Labour to win a majority of the seats and votes, and (c) for the number of
UKIP seats to dramatically drop, and with that perhaps even the independent MSs
who defected from UKIP, but won regional party list races.
[1] For a discussion of contemporary
voter volatility in the United Kingdom, see: Fieldhouse, EA, et.al. (2020) Electoral
Shocks: The Volatile Voter in a Turbulent World, Oxford: OUP; Fieldhouse,
EA, Evans, G, Green, J, Mellon, J & Prosser, C (2021), 'Volatility,
Realignment and Electoral Shocks: Brexit and the UK General Election of 2019', SSRN
Electronic Journal, http://dx.doi.org/10.2139/ssrn.3764477 (Accessed 4th
May 2021).
[2] BBC News (23rd February
2021) ‘Local Elections Postponed in Three English Counties’, BBC News,
https://w ww.bbc.co.uk/news/uk-england-56168977 (Accessed 4th May 2021).
[3] The data utilised in this section
and in Figure 1a. has been drawn from: House of Commons Library, Elise Uberoi
(2020) Turnout at Elections - Briefing Paper - Number CBP8060, London:
House of Commons Library, p.4 and p. 15.
[4] Probabilities made by calculating
the area under a normal distribution curve using the dataset of Fig. 1a.
[5] The data utilised in this section
and for Figures 1b. and 1c. has been drawn from: House of Commons Library,
Lukas Audickas, Richard Cracknell and Philip Loft (2020) UK Election
Statistics: 1918-2019: A Century of Elections - Briefing Paper – Number CBP7529,
London: House of Commons Library, pp. 64-66.
[6] For a good discussion of the rise
and decline of UKIP, see: Matthew Goodwin and Caitlin Milazzo (2015) UKIP:
Inside the Campaign to Redraw the Map of British Politics, Oxford: OUP;
Matthew J. Goodwin and James Dennison (2018) “The Radical Right in The United
Kingdom”, in Jens Rydgren (Ed.), The Oxford Handbook of The Radical Right,
Oxford: OUP, pp. 521-544.
[7] For a discussion of differing
party systems, see: Giovanni Sartori (1976) Parties and Party Systems: A
Framework for Analysis, Cambridge: Cambridge University Press.
[8] The data utilised in this section
and Figures 1.d., 1.e., 1f. and 1g. has been drawn from: House of Commons
Library, Lukas Audickas, Richard Cracknell and Philip Loft (2020) UK Election
Statistics: 1918-2019: A Century of Elections - Briefing Paper – Number
CBP7529, London: House of Commons Library, p.68.
[9] The data utilised in this section and
Figures 1h., 1i., and 1j. have been compiled by the author from the following
sources: BBC News (2017) ‘England Local Election Results 2017’, BBC News,
https://www.bbc.co.uk/ news/topics/cmj34zmwx1lt/england-local-elections-2017
(Accessed 5th May 2021); BBC News (2013) ‘Local Elections 2013’, BBC News,
https://www.bbc.co.uk/news/uk-politics-21828547 (Accessed 5th May 2021); BBC
News (2009) ‘Election 2009: Councils A-Z’, BBC News, http://news.bbc.co.uk/1/shared/bsp/hi/elections/local_
council/09/html/region_999 99.stm (Accessed 5th May 2021); BBC News (2005)
‘Election 2005: Results A-Z’, BBC News, http://news. bbc.co.uk/1/shared/vote2005/locals/html/region_99999.stm
(Accessed 5th May 2021); BBC News (2001) ‘Local Election 2001: Local Council
Results A-Z’, BBC News, http://news.bbc.co.uk/ hi/english/static/vote2001/local_elections/atoz.stm
(Accessed 5th May 2021); Colin Rallings and Michael Thrasher (1997) Local
Elections Handbook 1997, Local Government Chronicle Elections Centre: Plymouth,
pp. 1-14.
[10] The Conservative Party currently
hold an average 5% lead on the Labour Party in national opinion polls, with 41%
against 36%; see: Politico (May 6th 2021) ‘United Kingdom: Poll of
Polls – National Parliament Voting Intention’, politico.eu, htt
ps://www.politico.eu/europe-poll-of-polls/united-kingdom/ (Accessed 6th
May 2021).
[11] For a greater discussion on this
topic, see: Tim Bale (2018) ‘Who leads and who follows? The symbiotic
relationship between UKIP and the Conservatives – and populism and
Euroscepticism’, Politics, 38(3), pp. 263-277.
[12] House of Commons Library, Oliver
Hawkins, Richard Keen, Nambassa Nakatudde (2015) General Election 2015 –
Briefing Paper Number CBP7186, London: House of Commons Library, p. 36
[13] UK Parliament (2021) ‘Voting
Systems in the UK’, parliament.uk, https://www.parliament.uk/about/how/elec
tions-and-voting/voting-systems/ (Accessed 6th May 2021).
[14] The data utilised in this section
and in Figure 2a. has been drawn from: House of Commons Library, Elise Uberoi
(2020) Turnout at Elections - Briefing Paper - Number CBP8060, London: House of
Commons Library, p.13.
[15] The data for this
section and Figures 2b., 2c., 2d. and 2e. have been drawn from the following
sources: BBC News (2016) ‘Scotland Election 2016’, BBC News,
https://www.bbc.co.uk/news/election/ 2016/Scotland/results (Accessed 6th
May 2021); (2011) ‘Vote 2011: Scotland Elections’, BBC News,
https://www.bbc.co.uk/news/ special/election2011/constituency/html/scotland.stm
(Accessed 6th May 2021); (2007) ‘Scottish Elections 2007’, BBC
News,
http://news.bbc.co.uk/1/shared/vote2007/scottish_parliment/html/scoreboard_9999
9.stm (Accessed 6th May 2021); (2003) ‘Scottish Parliament
Elections’, BBC News, http://news.bbc.co.uk/1/shared/bsp/hi/ vote2003/scottish_parliament/html/main_score
board.stm (Accessed 6th May 2021); House of Commons Library and Bryn
Morgan (1999) Scottish Parliament Elections: 6 May 1999 – Research Paper
99/50, London: House of Commons Library, p.6.
[16] YouGov (May 4th 2021) ‘A Pro-Independence Majority is Likely’, yougov.co.uk, https://yougov.co.uk/topics/po litics/articles-reports/2021/05/04/scottish-voting-intention-snp-52-con-20-lab-19-2-4 (Accessed 6th May 2021).
[17] The data for this section and
Figures 3a. 3b. and 3c., 3d. and 3e. has
been drawn from: House of Commons Library, Elise Uberoi (2020) Turnout at
Elections - Briefing Paper - Number CBP8060, London: House of Commons Library,
p.13.; BBC News (2016) ‘Wales Election 2016’, BBC News, https://www.bbc.co.uk/
news/election/2016/wales/ results (Accessed 6th May 2021); (2011) ‘Vote
2011: Wales Election’, BBC News, https://www.bbc.co.uk/news/ special/election2011/overview/html/wales.stm
(Accessed 6th May 2021); (2007) ‘Welsh Assembly Election 2007’, BBC
News, http://news.bbc.co.uk/1/shared/vote2007/welshasssembly_ english/html/region_99999.stm;
(2003) ‘Welsh Assembly Election’, BBC News, http://news.bbc .co.uk/1/shared/
bsp/hi/vote2003/welsh_assembly/html/main_scoreboard.stm (Accessed 6th May 2021);
House of Commons Library and Bryn Morgan (1999) Welsh Assembly Elections: 6
May 1999: Research Paper 99/51, London: House of Commons Library, p. 6.